Belle House Transactions
Compare
3Y vs 3Y
Not available when time period filter is set to "All"
Economic Indicators
Avg. price/ft²
-
/Sqft
Trans count
-
Total trans value
-
Avg. price/ft²:
Hong Kong GDP:
Hang Seng Index:
Unemployment Rate:
Private Domestic Price Index:
Private Domestic Rental Index:
US Dollar Index:
┅
Avg. price/ft²
Hong Kong GDP
Hang Seng Index
Unemployment Rate
Private Domestic Price Index
Private Domestic Rental Index
US Dollar Index
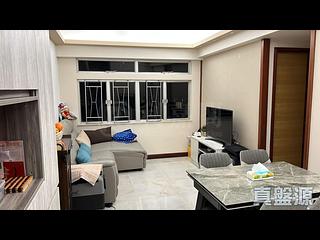
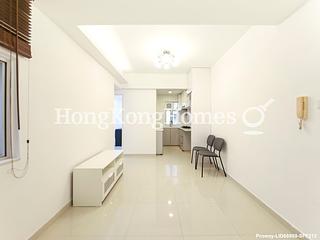
Latest transactions and listings in Belle House
Don’t miss out! keep up with the latest transactions and listings in Belle House
Belle House Recent Transactions
Transaction Date
Floor
Flat
Price
Area (Sqft)
Price per Sqft
2026-05-12
3
1
HK$5.38M
510/579
HK$10,549
2025-08-29
22
6
HK$5.25M
494/581
HK$10,628
2025-08-18
13
5
HK$8.25M
510/604
HK$16,176
2025-07-17
19
1
HK$5.10M
502/579
HK$10,159
2025-03-18
15
5
HK$6.75M
510/604
HK$13,235
2024-10-16
23
6
HK$4.80M
494/581
HK$9,717
2024-07-22
14
3
HK$6.80M
503/582
HK$13,519
2023-11-21
17
6
HK$3.00M
494/581
HK$6,073
2023-08-23
18
2
HK$6.30M
515/605
HK$12,233
2023-07-06
8
1
HK$6.10M
510/650
HK$11,961
Properties for sale in Belle House

We’re always looking to improve our transaction section. Have ideas or suggestions? Email us at [email protected] – we’d love to hear from you!
The data from the all new Spacious Data Transaction Analysis (Beta) is for reference only. Any use or reference to such data is at your own risk.


