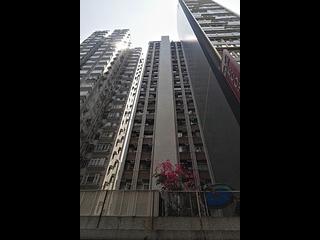
Kui Lee Building Transactions
Compare
3Y vs 3Y
Not available when time period filter is set to "All"
Economic Indicators
Avg. price/ft²
-
/Sqft
Trans count
-
Total trans value
-
Avg. price/ft²:
Hong Kong GDP:
Hang Seng Index:
Unemployment Rate:
Private Domestic Price Index:
Private Domestic Rental Index:
US Dollar Index:
┅
Avg. price/ft²
Hong Kong GDP
Hang Seng Index
Unemployment Rate
Private Domestic Price Index
Private Domestic Rental Index
US Dollar Index
Latest transactions and listings in Kui Lee Building
Don’t miss out! keep up with the latest transactions and listings in Kui Lee Building
Kui Lee Building Recent Transactions
Transaction Date
Floor
Flat
Price
Area (Sqft)
Price per Sqft
2025-12-04
16
B
HK$3.60M
307/432
HK$11,726
2023-01-30
12
A
HK$4.10M
307/432
HK$13,355
2020-06-15
21
B
HK$5.58M
307/432
HK$18,176
2020-05-15
15
A
HK$5.30M
307/432
HK$17,264
2019-02-15
1
A
HK$6.50M
307/0
HK$21,173
2018-07-13
10
A
HK$5.25M
307/432
HK$17,101
2018-05-08
21
A
HK$5.20M
307/432
HK$16,938
2017-11-03
7
A
HK$4.50M
307/432
HK$14,658
2017-04-26
19
B
HK$4.28M
307/432
HK$13,941
2016-10-28
12
A
HK$4.40M
307/432
HK$14,332
Properties for sale in Kui Lee Building
We’re always looking to improve our transaction section. Have ideas or suggestions? Email us at [email protected] – we’d love to hear from you!
The data from the all new Spacious Data Transaction Analysis (Beta) is for reference only. Any use or reference to such data is at your own risk.


