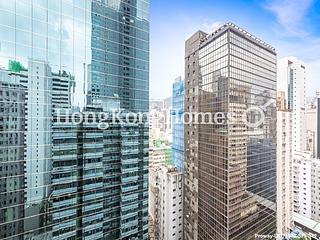
Capital Building Transactions
Compare
3Y vs 3Y
Not available when time period filter is set to "All"
Economic Indicators
Avg. price/ft²
-
/Sqft
Trans count
-
Total trans value
-
Avg. price/ft²:
Hong Kong GDP:
Hang Seng Index:
Unemployment Rate:
Private Domestic Price Index:
Private Domestic Rental Index:
US Dollar Index:
┅
Avg. price/ft²
Hong Kong GDP
Hang Seng Index
Unemployment Rate
Private Domestic Price Index
Private Domestic Rental Index
US Dollar Index
Latest transactions and listings in Capital Building
Don’t miss out! keep up with the latest transactions and listings in Capital Building
Capital Building Recent Transactions
Transaction Date
Floor
Flat
Price
Area (Sqft)
Price per Sqft
2026-07-02
5
F
HK$700.00K
259/0
HK$2,703
2026-06-25
15
G
HK$3.48M
259/308
HK$13,436
2026-05-15
9
E
HK$4.24M
329/480
HK$12,881
2026-04-16
7
F
HK$3.04M
259/0
HK$11,737
2025-12-17
18
F
HK$3.88M
259/400
HK$14,981
2025-05-12
10
G
HK$3.00M
259/400
HK$11,583
2024-08-29
5
A
HK$4.28M
420/0
HK$10,190
2024-08-07
5
C
HK$5.00M
439/530
HK$11,390
2024-04-18
10
E
HK$4.28M
329/0
HK$13,009
2023-07-04
18
F
HK$3.62M
259/400
HK$13,977
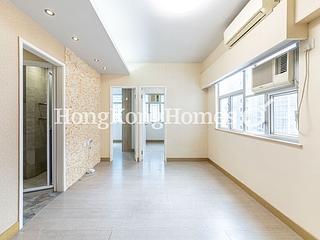
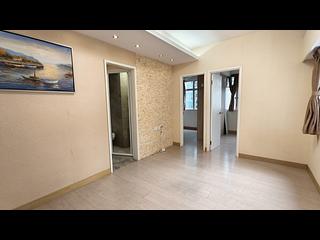
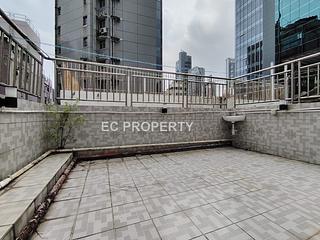
Properties for sale in Capital Building
We’re always looking to improve our transaction section. Have ideas or suggestions? Email us at [email protected] – we’d love to hear from you!
The data from the all new Spacious Data Transaction Analysis (Beta) is for reference only. Any use or reference to such data is at your own risk.


