Sam Yuen Mansion Transactions
Compare
3Y vs 3Y
Not available when time period filter is set to "All"
Economic Indicators
Avg. price/ft²
-
/Sqft
Trans count
-
Total trans value
-
Avg. price/ft²:
Hong Kong GDP:
Hang Seng Index:
Unemployment Rate:
Private Domestic Price Index:
Private Domestic Rental Index:
US Dollar Index:
┅
Avg. price/ft²
Hong Kong GDP
Hang Seng Index
Unemployment Rate
Private Domestic Price Index
Private Domestic Rental Index
US Dollar Index
Latest transactions and listings in Sam Yuen Mansion
Don’t miss out! keep up with the latest transactions and listings in Sam Yuen Mansion
Sam Yuen Mansion Recent Transactions
Transaction Date
Floor
Flat
Price
Area (Sqft)
Price per Sqft
2026-07-10
8
A
HK$4.75M
389/513
HK$12,211
2026-07-07
7
B
HK$4.90M
386/513
HK$12,694
2026-03-03
8
B
HK$4.05M
386/513
HK$10,492
2022-09-02
7
A
HK$6.28M
389/513
HK$16,144
2021-08-18
16
B
HK$6.00M
386/513
HK$15,544
2021-07-21
16
B
HK$6.00M
386/513
HK$15,544
2021-06-11
12
A
HK$6.30M
389/513
HK$16,195
2021-02-11
19
B
HK$5.95M
386/513
HK$15,415
2021-01-05
20
A
HK$6.00M
389/513
HK$15,424
2020-12-14
20
B
HK$4.00M
386/513
HK$10,363
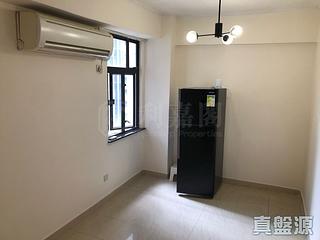
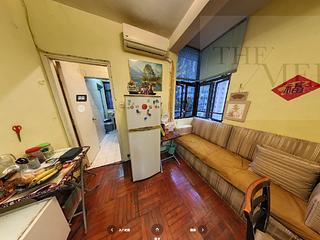
Properties for sale in Sam Yuen Mansion
We’re always looking to improve our transaction section. Have ideas or suggestions? Email us at [email protected] – we’d love to hear from you!
The data from the all new Spacious Data Transaction Analysis (Beta) is for reference only. Any use or reference to such data is at your own risk.


