Seymour Transactions
Compare
3Y vs 3Y
Not available when time period filter is set to "All"
Economic Indicators
Avg. price/ft²
-
/Sqft
Trans count
-
Total trans value
-
Avg. price/ft²:
Hong Kong GDP:
Hang Seng Index:
Unemployment Rate:
Private Domestic Price Index:
Private Domestic Rental Index:
US Dollar Index:
┅
Avg. price/ft²
Hong Kong GDP
Hang Seng Index
Unemployment Rate
Private Domestic Price Index
Private Domestic Rental Index
US Dollar Index
Latest transactions and listings in Seymour
Don’t miss out! keep up with the latest transactions and listings in Seymour
Seymour Recent Transactions
Transaction Date
Floor
Flat
Price
Area (Sqft)
Price per Sqft
2026-03-19
32
B
HK$34.00M
1398/1878
HK$24,320
2025-11-18
18
B
HK$30.00M
1398/1878
HK$21,459
2025-11-06
18
B
HK$30.00M
1398/1878
HK$21,459
2025-08-08
38
B
HK$37.00M
1398/1878
HK$26,466
2025-01-17
10
B
HK$5.40M
1398/1878
HK$3,863
2025-01-17
10
B
HK$5.40M
1398/1878
HK$3,863
2024-11-08
33
B
HK$38.00M
1398/1878
HK$27,182
2024-07-26
62
A
HK$65.00M
1730/2348
HK$37,572
2024-07-18
62
B
HK$45.00M
1398/1878
HK$32,189
2023-06-15
30
B
HK$42.00M
1398/1878
HK$30,043
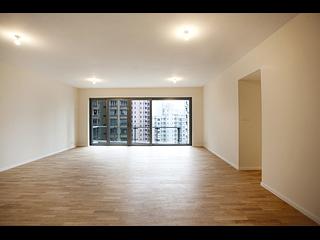
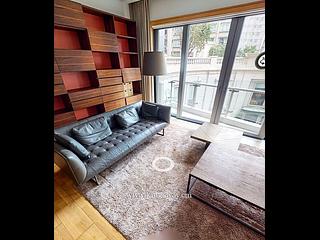
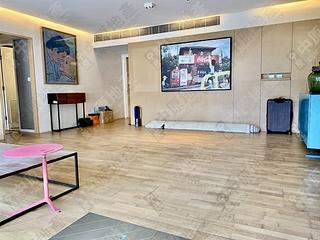
Properties for sale in Seymour

We’re always looking to improve our transaction section. Have ideas or suggestions? Email us at [email protected] – we’d love to hear from you!
The data from the all new Spacious Data Transaction Analysis (Beta) is for reference only. Any use or reference to such data is at your own risk.


