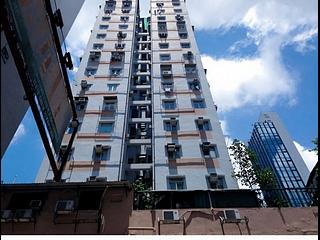
Kam Po Building Transactions
Compare
3Y vs 3Y
Not available when time period filter is set to "All"
Economic Indicators
Avg. price/ft²
-
/Sqft
Trans count
-
Total trans value
-
Avg. price/ft²:
Hong Kong GDP:
Hang Seng Index:
Unemployment Rate:
Private Domestic Price Index:
Private Domestic Rental Index:
US Dollar Index:
┅
Avg. price/ft²
Hong Kong GDP
Hang Seng Index
Unemployment Rate
Private Domestic Price Index
Private Domestic Rental Index
US Dollar Index
Latest transactions and listings in Kam Po Building
Don’t miss out! keep up with the latest transactions and listings in Kam Po Building
Kam Po Building Recent Transactions
Transaction Date
Floor
Flat
Price
Area (Sqft)
Price per Sqft
2026-02-09
6
A
HK$3.40M
349/462
HK$9,742
2023-06-07
3
C
HK$4.60M
407/538
HK$11,302
2022-10-06
6
B
HK$5.30M
407/0
HK$13,022
2021-12-29
13
B
HK$6.20M
407/0
HK$15,233
2021-04-01
8
A
HK$5.28M
349/462
HK$15,129
2021-01-08
4
A
HK$4.98M
349/462
HK$14,269
2020-09-25
13
C
HK$5.50M
407/500
HK$13,514
2020-08-20
11
B
HK$3.00M
407/0
HK$7,371
2020-06-11
15
A
HK$4.88M
328/444
HK$14,878
2019-09-17
16
B
HK$9.50M
732/0
HK$12,978
Properties for sale in Kam Po Building
We’re always looking to improve our transaction section. Have ideas or suggestions? Email us at [email protected] – we’d love to hear from you!
The data from the all new Spacious Data Transaction Analysis (Beta) is for reference only. Any use or reference to such data is at your own risk.


