Po Lee Building Transactions
Compare
3Y vs 3Y
Not available when time period filter is set to "All"
Economic Indicators
Avg. price/ft²
-
/Sqft
Trans count
-
Total trans value
-
Avg. price/ft²:
Hong Kong GDP:
Hang Seng Index:
Unemployment Rate:
Private Domestic Price Index:
Private Domestic Rental Index:
US Dollar Index:
┅
Avg. price/ft²
Hong Kong GDP
Hang Seng Index
Unemployment Rate
Private Domestic Price Index
Private Domestic Rental Index
US Dollar Index
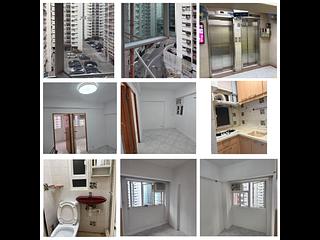
Latest transactions and listings in Po Lee Building
Don’t miss out! keep up with the latest transactions and listings in Po Lee Building
Po Lee Building Recent Transactions
Transaction Date
Floor
Flat
Price
Area (Sqft)
Price per Sqft
2026-06-16
2
6
HK$2.50M
355/480
HK$7,042
2026-06-08
14
4
HK$2.40M
295/450
HK$8,136
2026-04-24
5
13
HK$2.50M
325/450
HK$7,692
2026-02-16
1
1
HK$2.80M
385/0
HK$7,273
2025-12-10
1
7
HK$2.30M
341/0
HK$6,745
2025-12-02
3
9
HK$2.28M
316/0
HK$7,215
2025-10-03
2
4
HK$1.98M
341/500
HK$5,806
2025-09-16
15
6
HK$3.25M
270/0
HK$12,037
2025-08-12
10
4
HK$2.65M
341/450
HK$7,771
2025-06-03
11
11
HK$700.00K
210/284
HK$3,333
Properties for sale in Po Lee Building
We’re always looking to improve our transaction section. Have ideas or suggestions? Email us at [email protected] – we’d love to hear from you!
The data from the all new Spacious Data Transaction Analysis (Beta) is for reference only. Any use or reference to such data is at your own risk.


