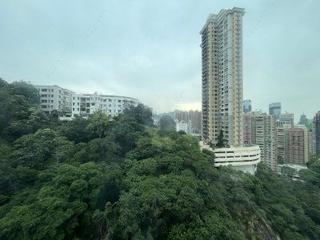
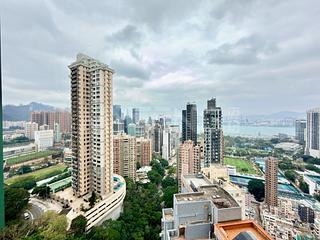
Y.I Transactions
Compare
3Y vs 3Y
Not available when time period filter is set to "All"
Economic Indicators
Avg. price/ft²
-
/Sqft
Trans count
-
Total trans value
-
Avg. price/ft²:
Hong Kong GDP:
Hang Seng Index:
Unemployment Rate:
Private Domestic Price Index:
Private Domestic Rental Index:
US Dollar Index:
┅
Avg. price/ft²
Hong Kong GDP
Hang Seng Index
Unemployment Rate
Private Domestic Price Index
Private Domestic Rental Index
US Dollar Index
Latest transactions and listings in Y.I
Don’t miss out! keep up with the latest transactions and listings in Y.I
Y.I Recent Transactions
Transaction Date
Floor
Flat
Price
Area (Sqft)
Price per Sqft
2026-06-04
15
C
HK$10.48M
496/706
HK$21,129
2026-03-27
28
A
HK$17.60M
825/1175
HK$21,333
2026-02-26
32
A
HK$24.50M
1005/1420
HK$24,378
2026-02-06
19
B
HK$16.90M
825/1176
HK$20,485
2025-11-17
27
C
HK$9.00M
496/706
HK$18,145
2025-09-10
32
B
HK$22.38M
1005/1420
HK$22,269
2024-02-09
20
C
HK$8.70M
496/706
HK$17,540
2024-01-05
32
A
HK$26.30M
1005/1420
HK$26,169
2022-04-28
21
C
HK$11.20M
496/706
HK$22,581
2022-01-06
11
B
HK$19.38M
825/1176
HK$23,491
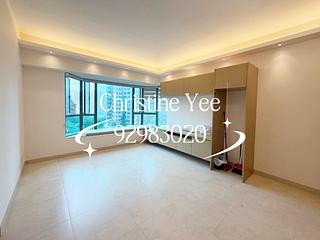
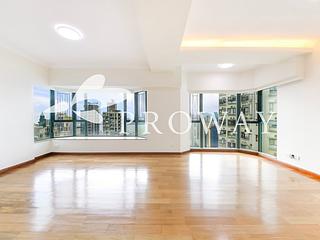
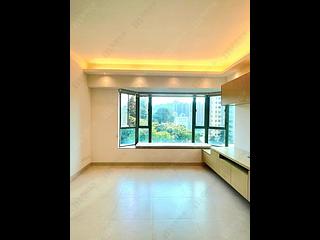
Properties for sale in Y.I


We’re always looking to improve our transaction section. Have ideas or suggestions? Email us at [email protected] – we’d love to hear from you!
The data from the all new Spacious Data Transaction Analysis (Beta) is for reference only. Any use or reference to such data is at your own risk.


