


No results found
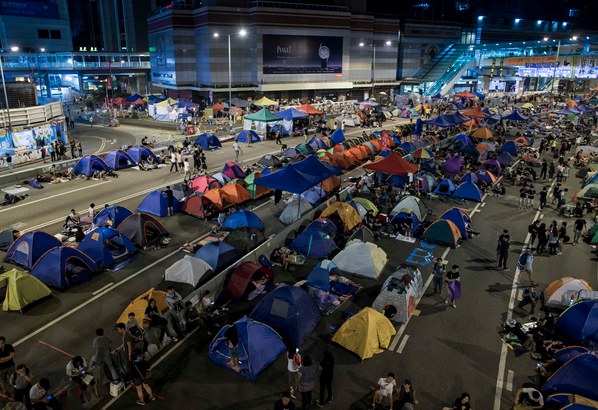
Hong Kong house prices and rentals rising again after Occupy Central
Hong Kong Property | March 17, 2015
Hong Kong price movements during Occupy Central
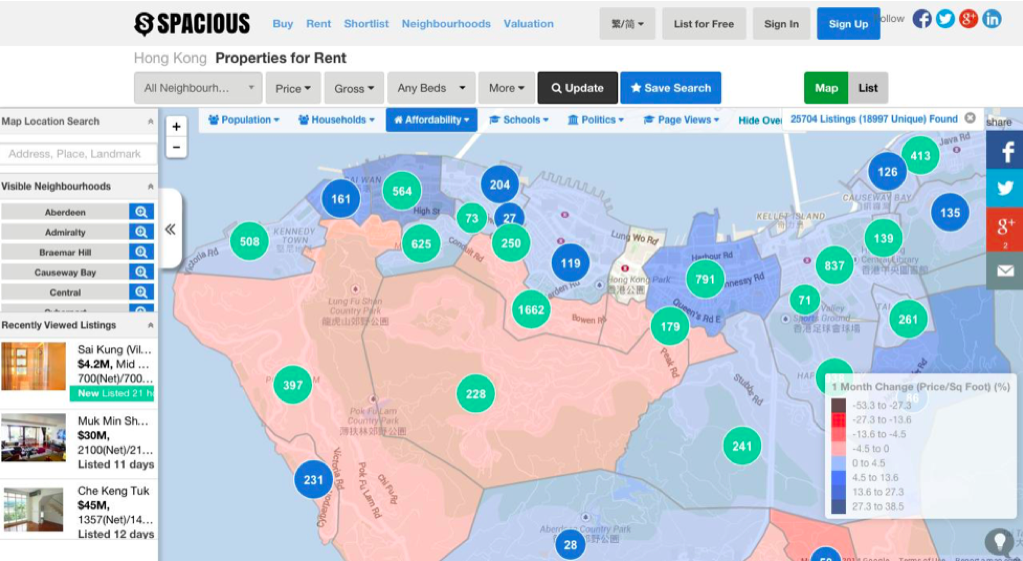
Last year, during Occupy Central we took a screenshot of the Spacious price trends chart. For those not familiar, pink means prices are dropping and blue means rising (screenshot below). The data presents an interesting overview with a couple of observations:
- In the more expensive areas of Hong Kong e.g. the Peak, Mid Levels Central, Repulse Bay, Shouson Hill and Pok Fu Lam, there were clear drops in prices. This was supported at the time by conversations we had with agents who mentioned investors from the mainland in particular were holding back on transacting as they were seriously concerned by Occupy Central.
- Despite Occupy Central, Sai Ying Pun and Shek Tong Tsui showed strong price increases. This is not surprising due to the development of the new MTR stations opening in the area.
- Wan Chai also shows an increase in price per square foot. Once again not surprising as many units in Wan Chai are sub divided, pushing up price per square foot. Prices in Wan Chai are somewhat of an outlier.
Price per square foot changes in mid 2014
Hong Kong price movements in early 2015
As can be seen from the graph showing price changes in early 2015, the trend has reversed with all neighbourhoods showing strong price increases.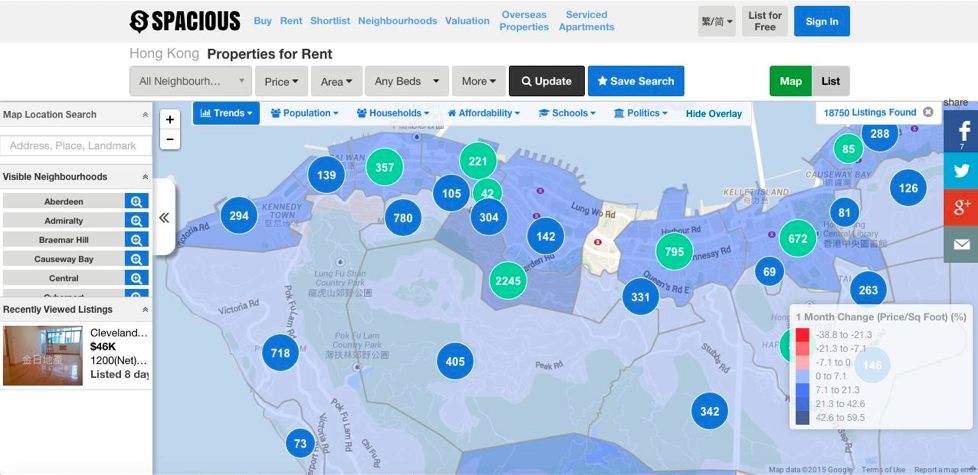
Not great news for those looking to get on the property ladder. The cost of living has always been an issue in Hong Kong and it doesn’t look like that is going away anytime soon.
Let’s hope the government plans to build more affordable housing units.
See this data, and more, for yourself by using our stunning map overlays.
You can also overlay demographic data, for example, showing where single people in Hong Kong live and what percentage of people in a particular neighborhood speak English.
Asif Ghafoor is the CEO and Founder of www.spacious.hk, www.spacious.tw, www.spacious.cn and www.spacious.sg, a real estate marketplace making it easier to buy or rent property across Asia.